much is said about collaborative creations in the design universe. in general, design is strongly related to the creative act, it is expected from the designer this skill and from the design the methods to optimize the creative process. this is even more relevant when we talk about collaborative creation, in groups, with people who do not always (or almost never) have a design training.
there are many methods to make the creative process more efficient and effective. from simple brainstorming to elaborate morphological boxes, design has learned, and continues to learn, the ways that lead people to create better, both alone and in groups, in co-creation teams [collaborative creation].
this post is about the other side of the coin, collaborative choice. co-selection is a method to support groups of people to choose the best proposals resulting from co-creation processes. the more efficient the creation method and the more skill the designer who conducts the co-creation dynamics has, the more interesting options we will have at the end of the sessions.
and now? what to do when we finish a co-creation session and we have several possibilities, all apparently good, all or at least a large part of them with the potential to work.
to choose the best proposals resulting from a co-creation session, we suggest an equally collaborative method, co-selection. and this is where our challenge begins: to create a method that makes it possible to do this in an explicit, structured way, where everyone collaborates on an equal footing in the group’s choices.
how to find out what people prefer?
faced with a list of proposals to be chosen, we suggest a simple mechanism that mixes subjectivity with objectivity to capture how much each person participating in the collaborative choice believes in each of the proposals.
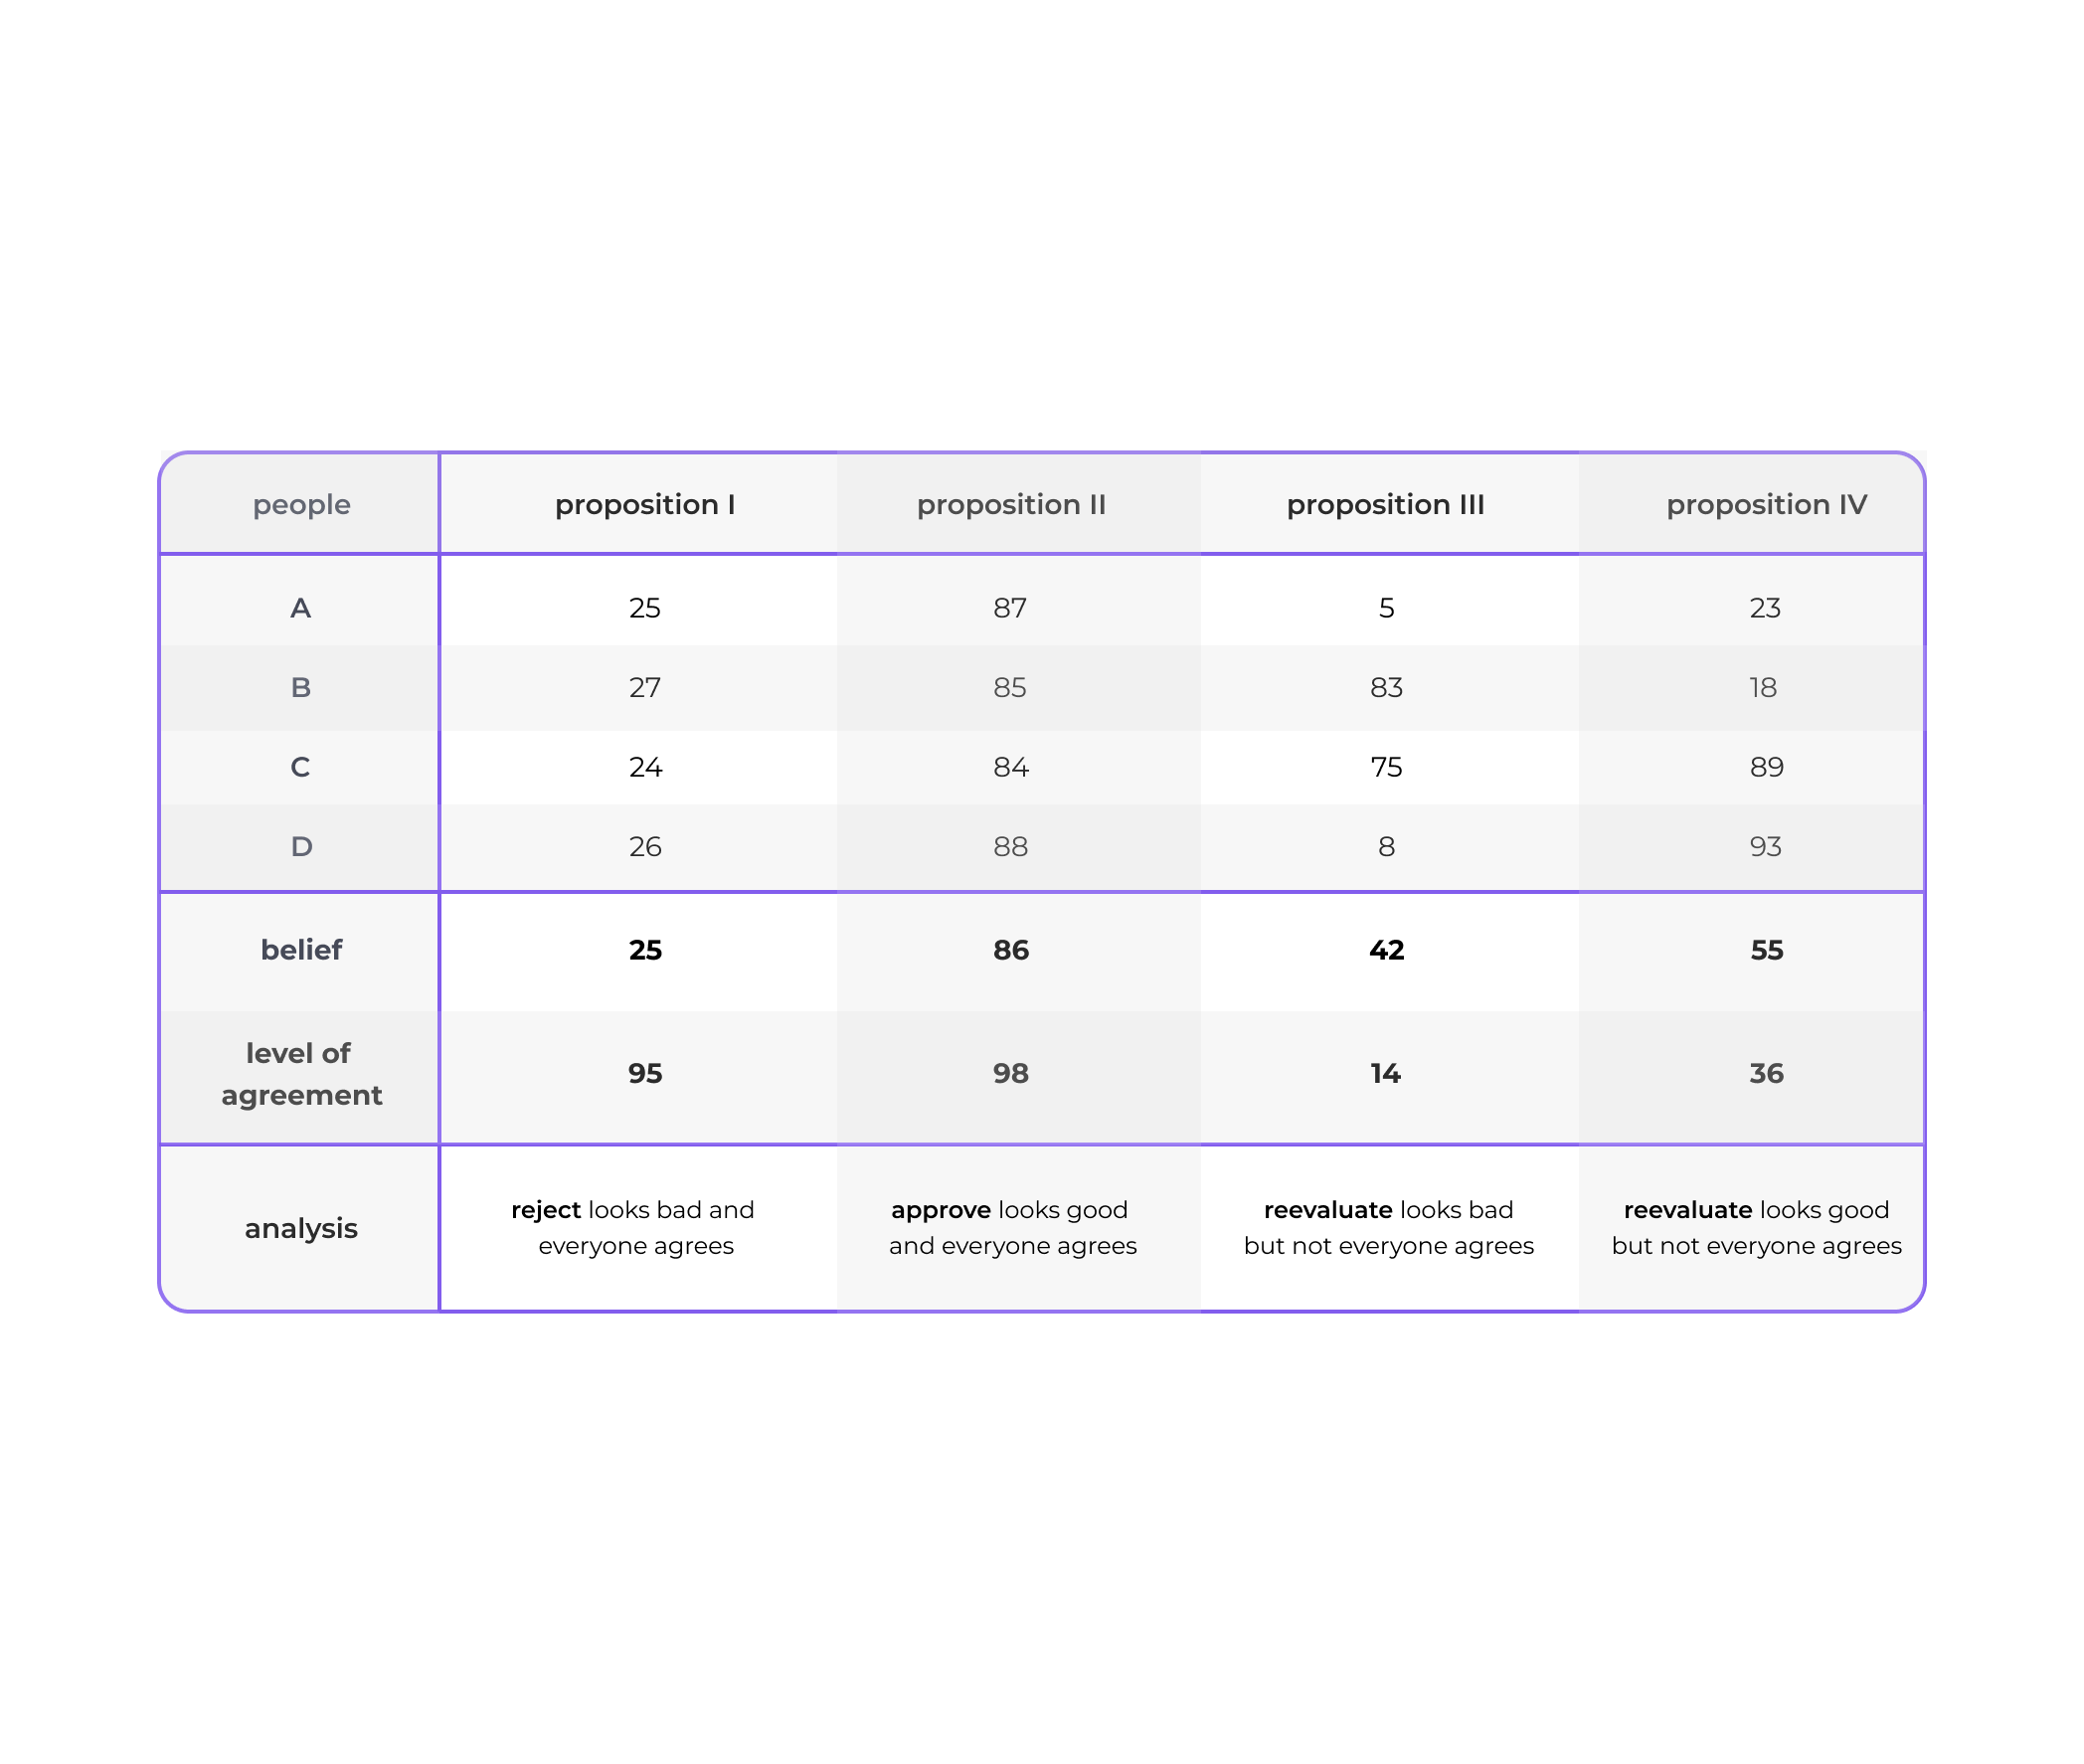
using a simple mechanism, based on a betting game metaphor, we deliver 100 chips for each person to bet on each of the proposals. there are not 100 cards to distribute among the proposals, but 100 cards for each proposal. people can bet a few chips on the proposal if they think it’s not very relevant, or bet a lot on the proposal if they think it’s very relevant. as in the following table.
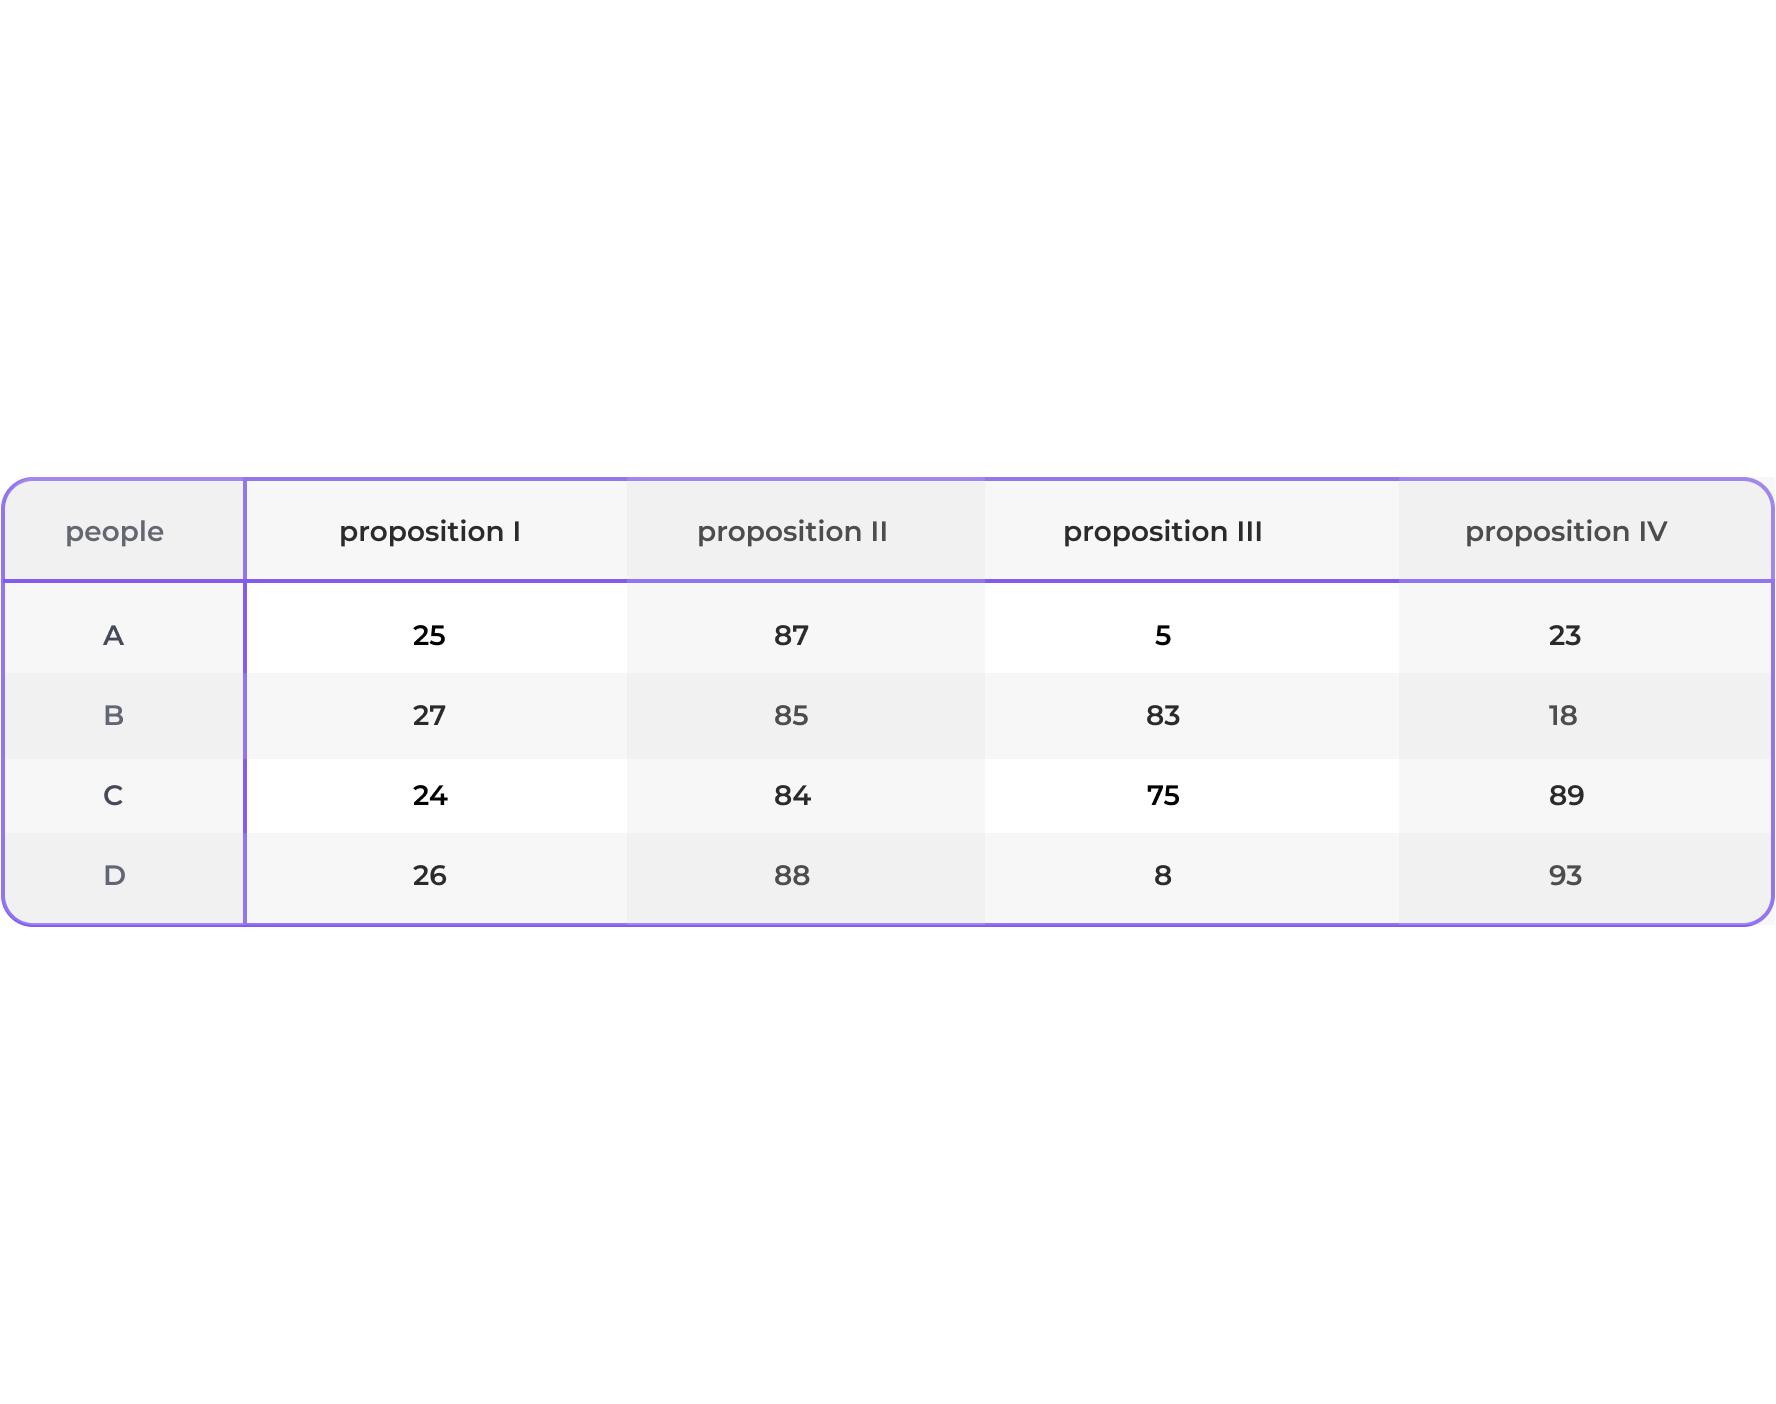
how to process this data to evaluate collaborative choices?
here it is necessary to recall some of the basic statistics classes of elementary school. As a starting point, we calculated the average number of chips bet on each of the proposals, indicating people’s average belief in each of the proposals.
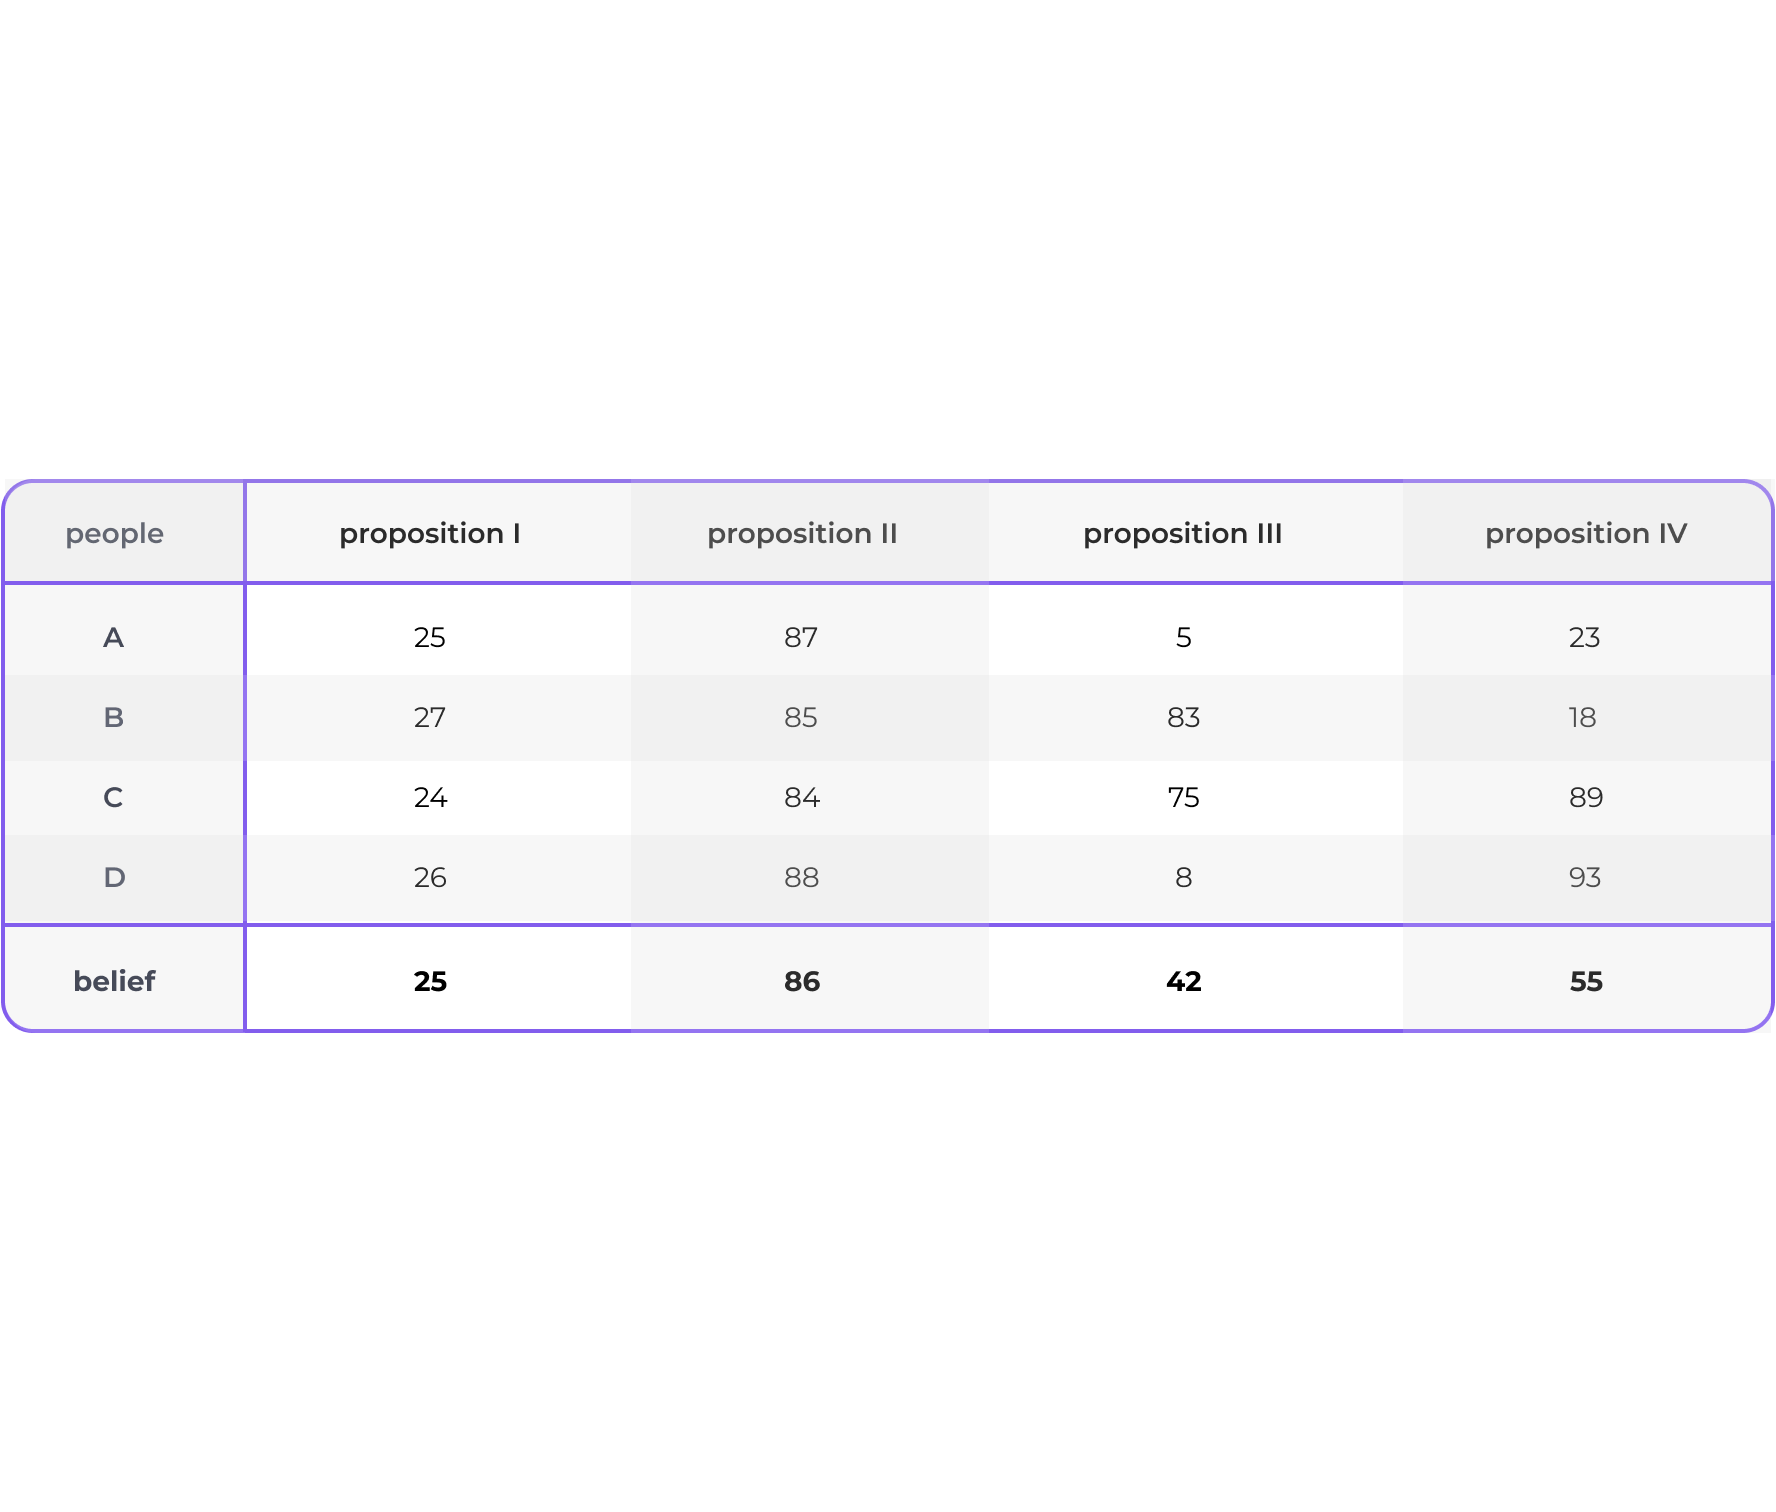
now we can safely say that the group has more consensus on proposals I and II than on proposals III and IV. in this case, the consensus is calculated as the inverse of dispersion, explaining the balance [or imbalance] between people’s choices.
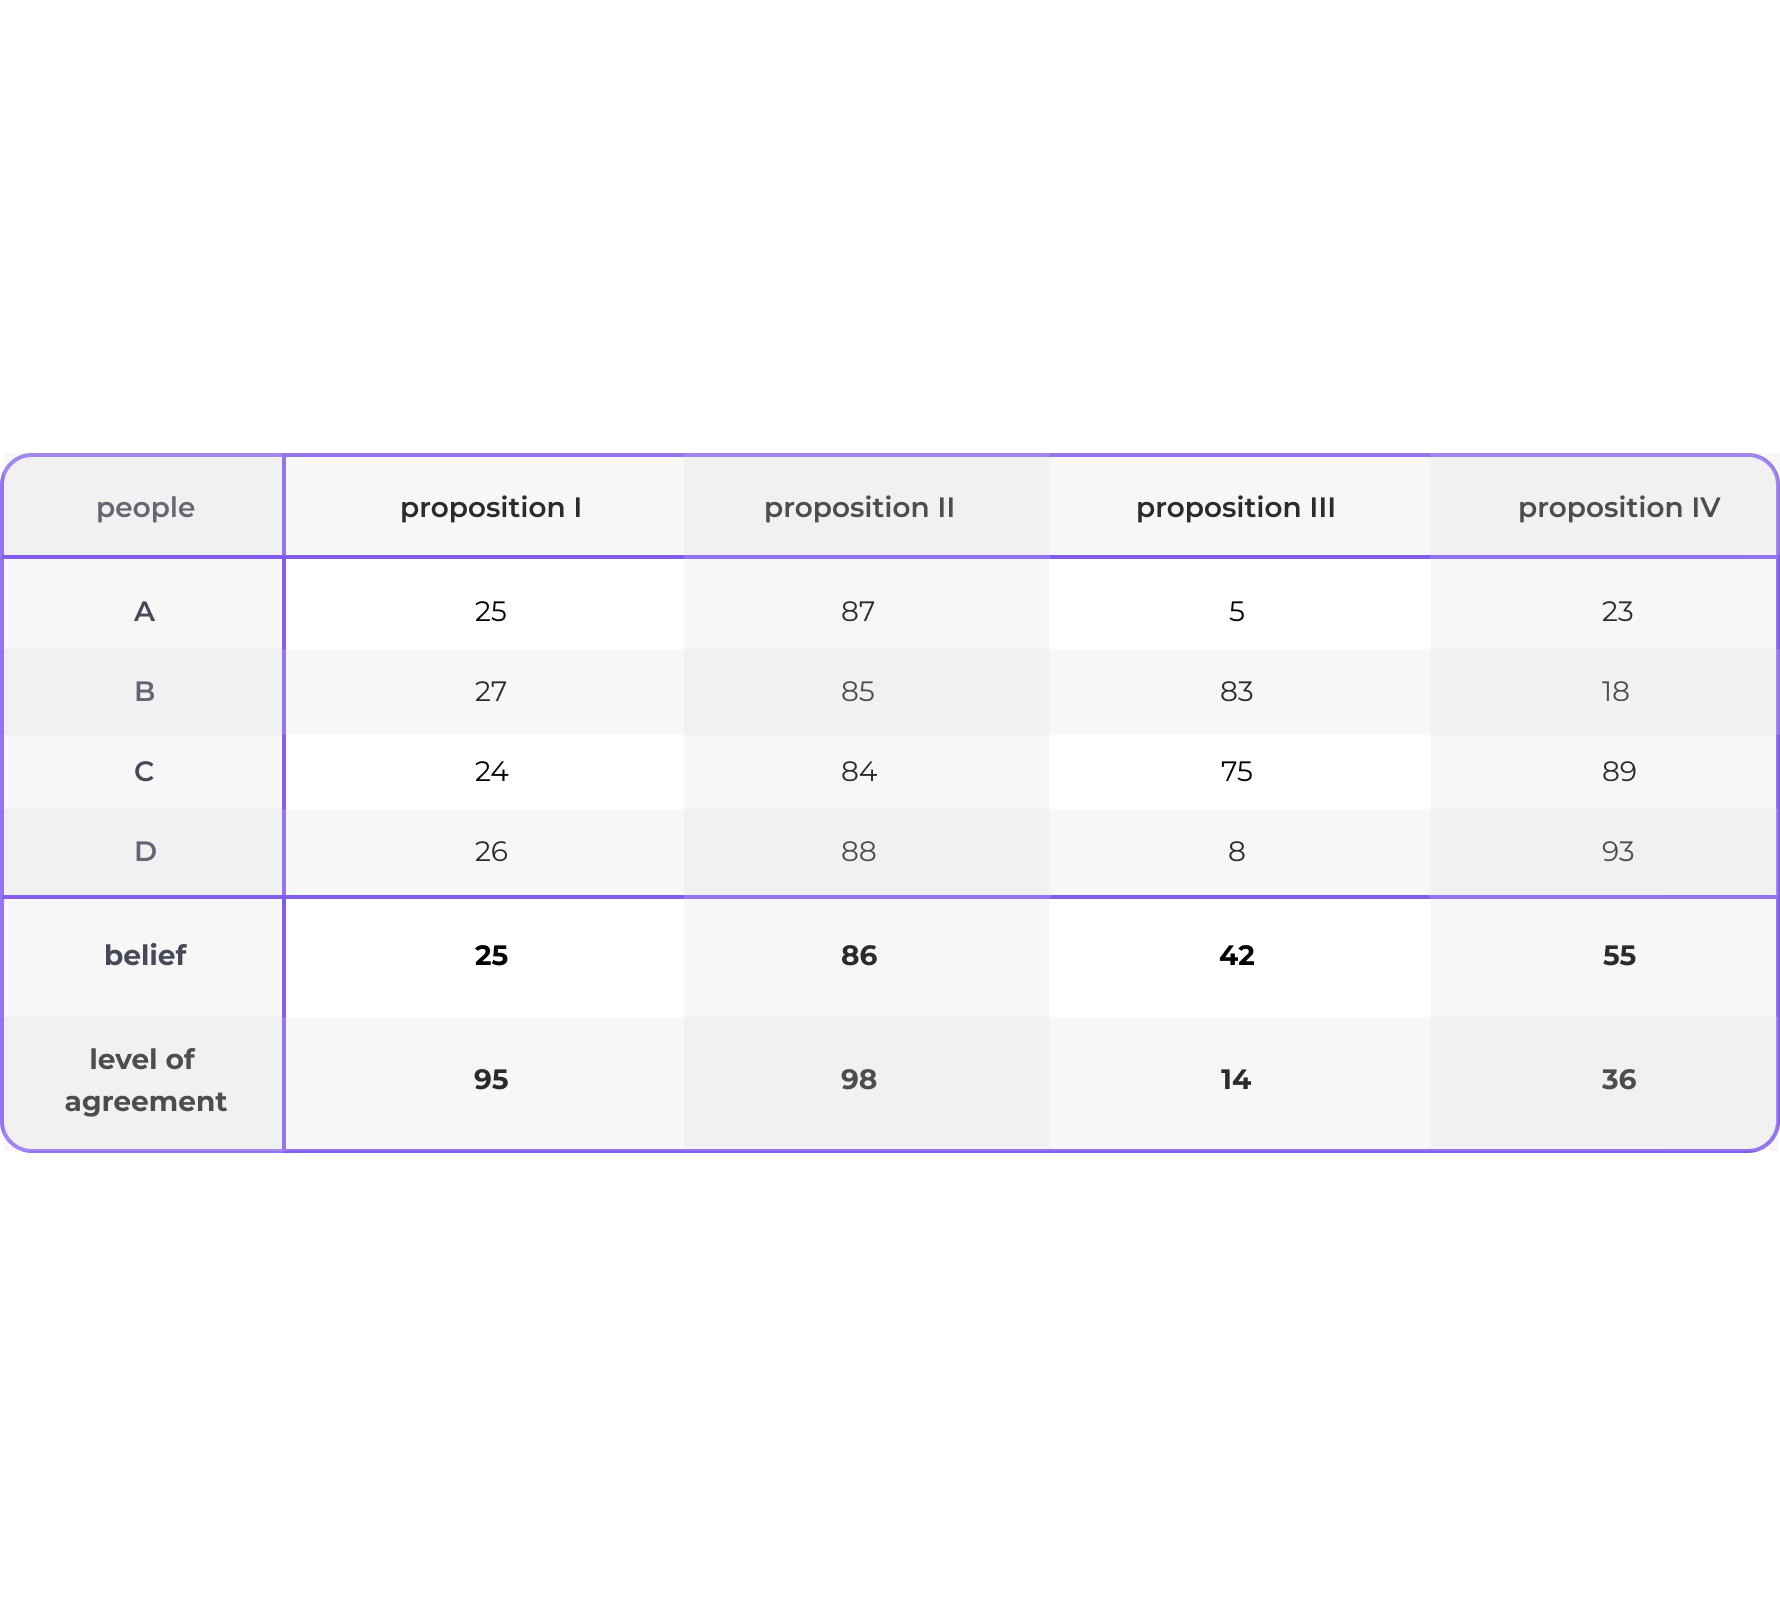
how to classify collaborative choices?
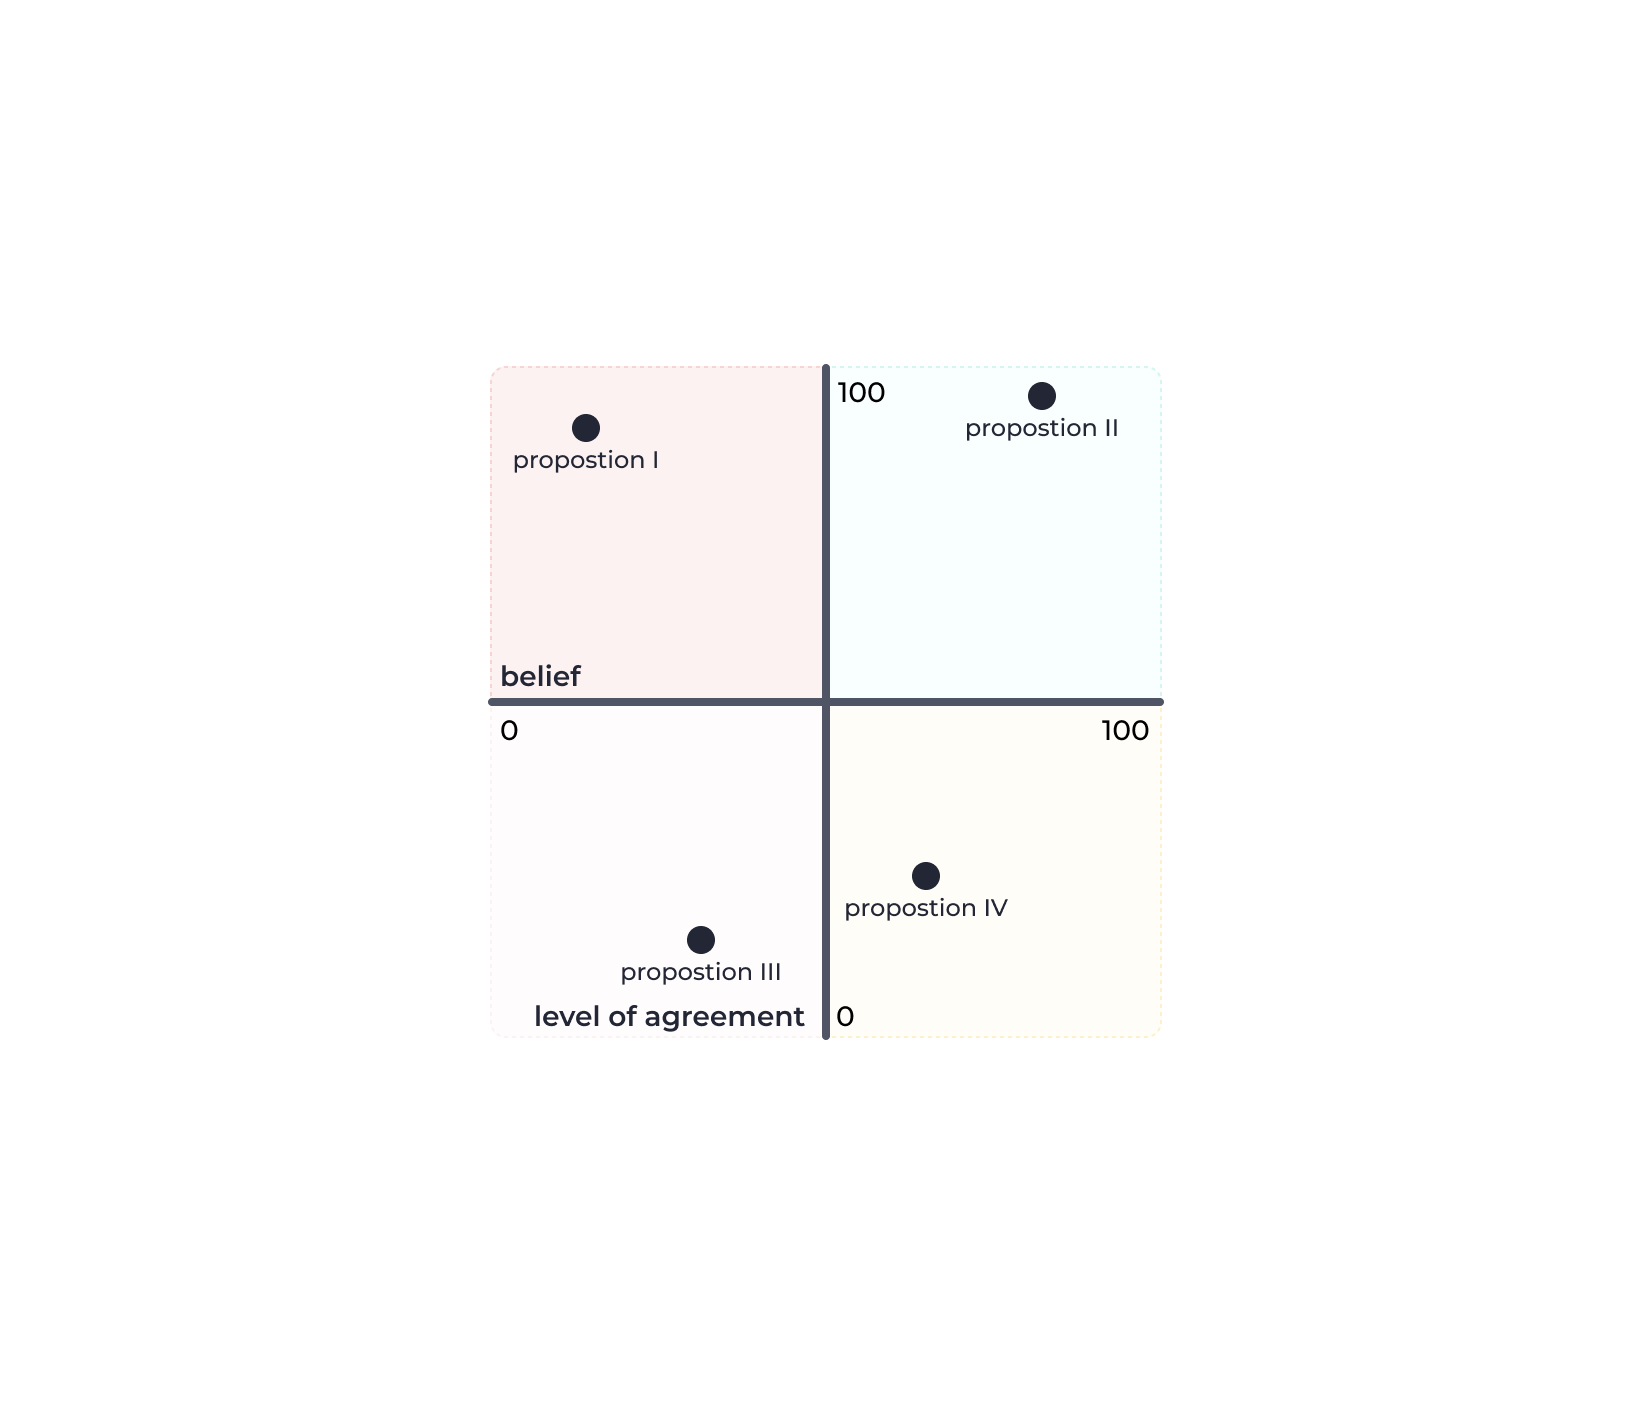
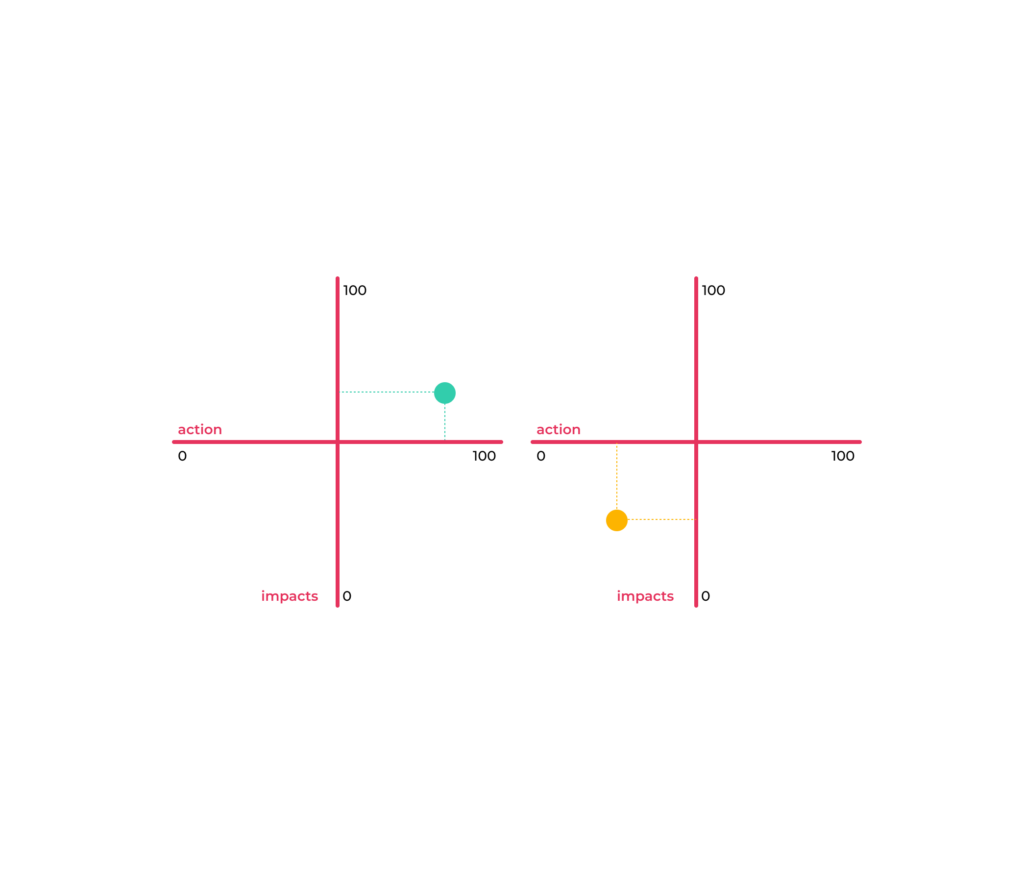
after being analyzed, we can classify the choices in quadrants, considering two axes, consensus as the vertical axis and beliefs as the horizontal axis.
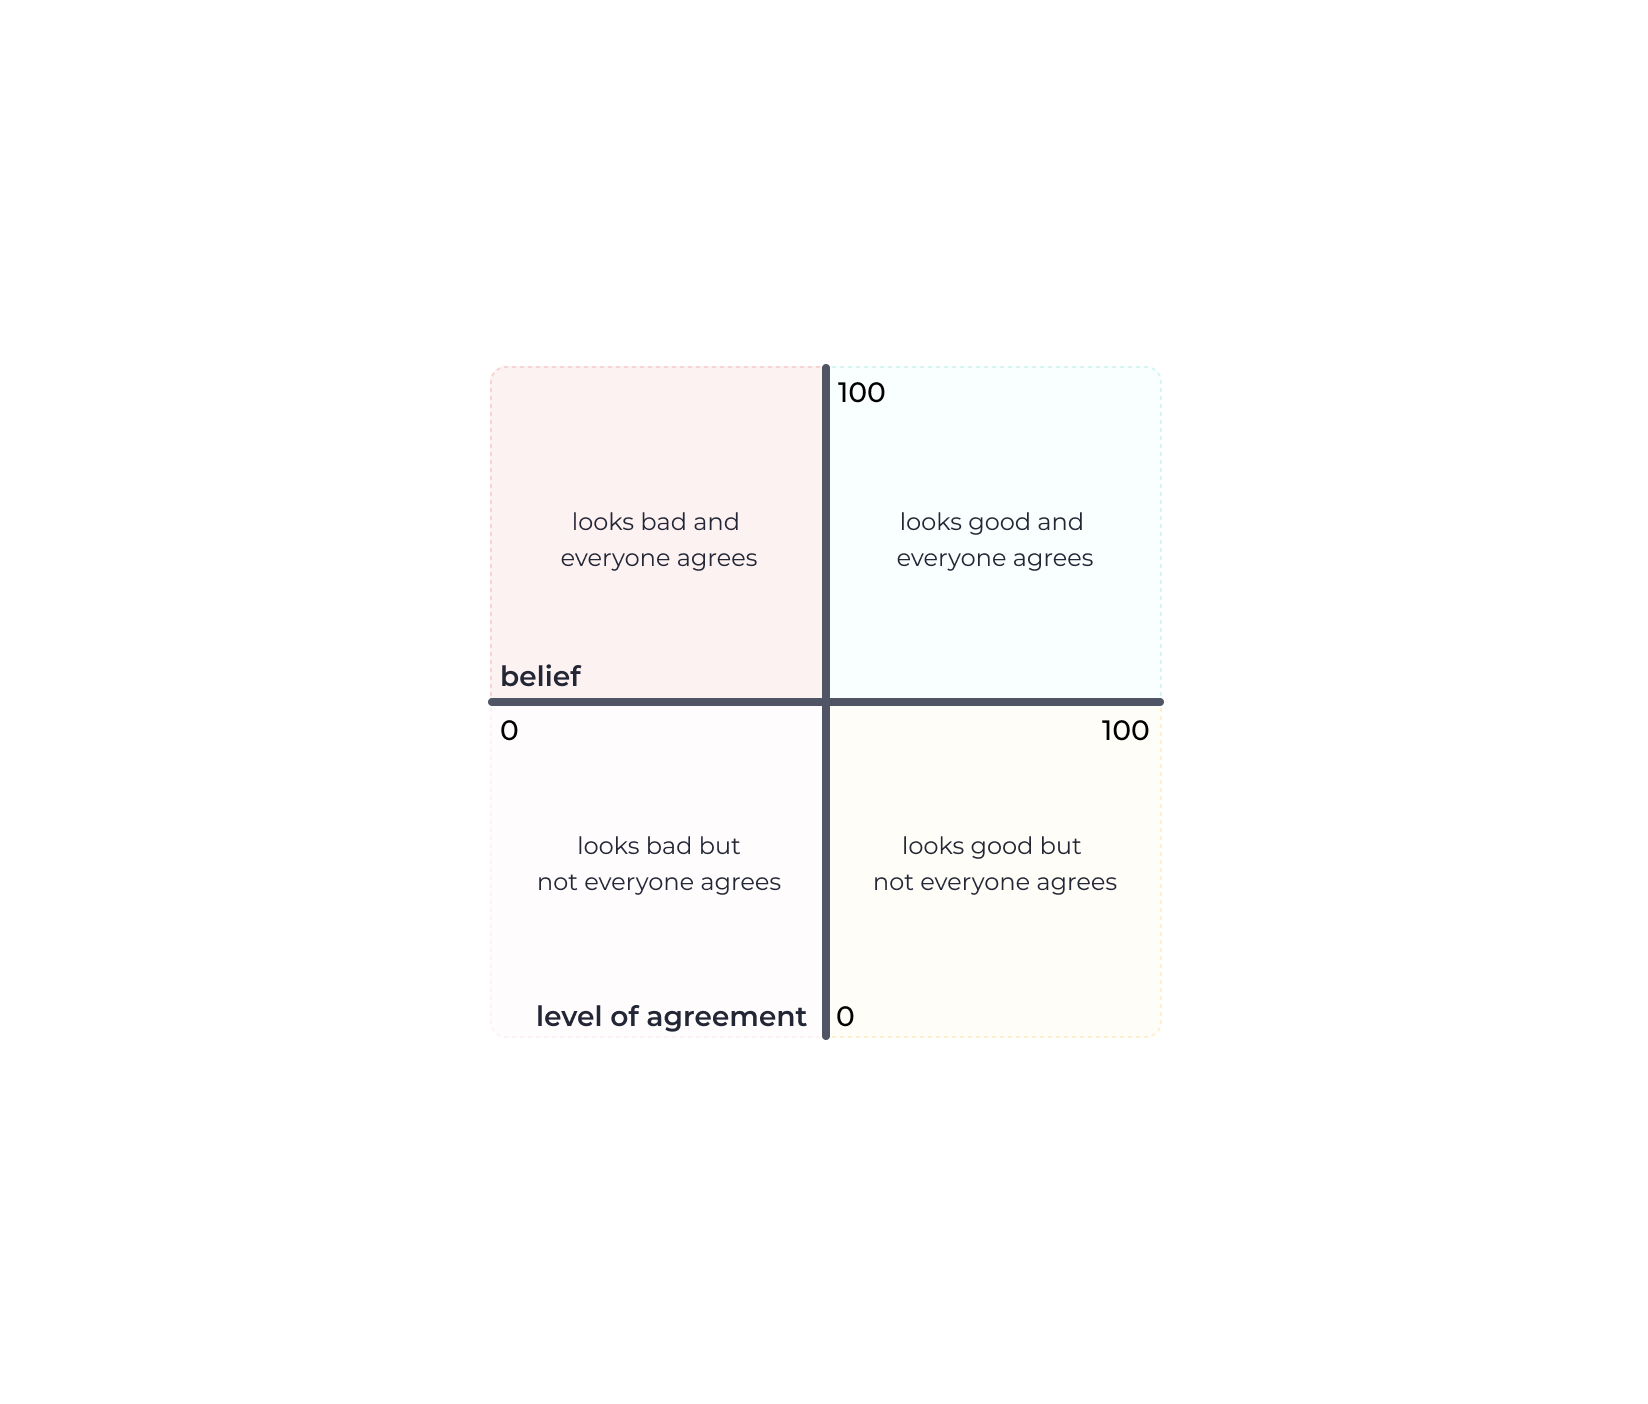
the choices that have beliefs above 50% and consensus above 50% would be in the upper right quadrant, of the proposals that seem good and the group consensually agrees with this evaluation. on the other hand, choices with beliefs below 50% and consensus above 50% would be in the upper left quadrant, indicating that people consensually agree that this is not a good proposal.
the other choices, those with a consensus below 50%, which are in the lower quadrants, regardless of the level of belief between the evaluation dimensions, indicate that the group does not have consensus in the evaluation and should be discussed again before taking any decision in relation to them.
of course, it is possible to tighten or loosen the criteria for ranking proposals in the quadrants, moving the axes up or down, to the right or to the left.
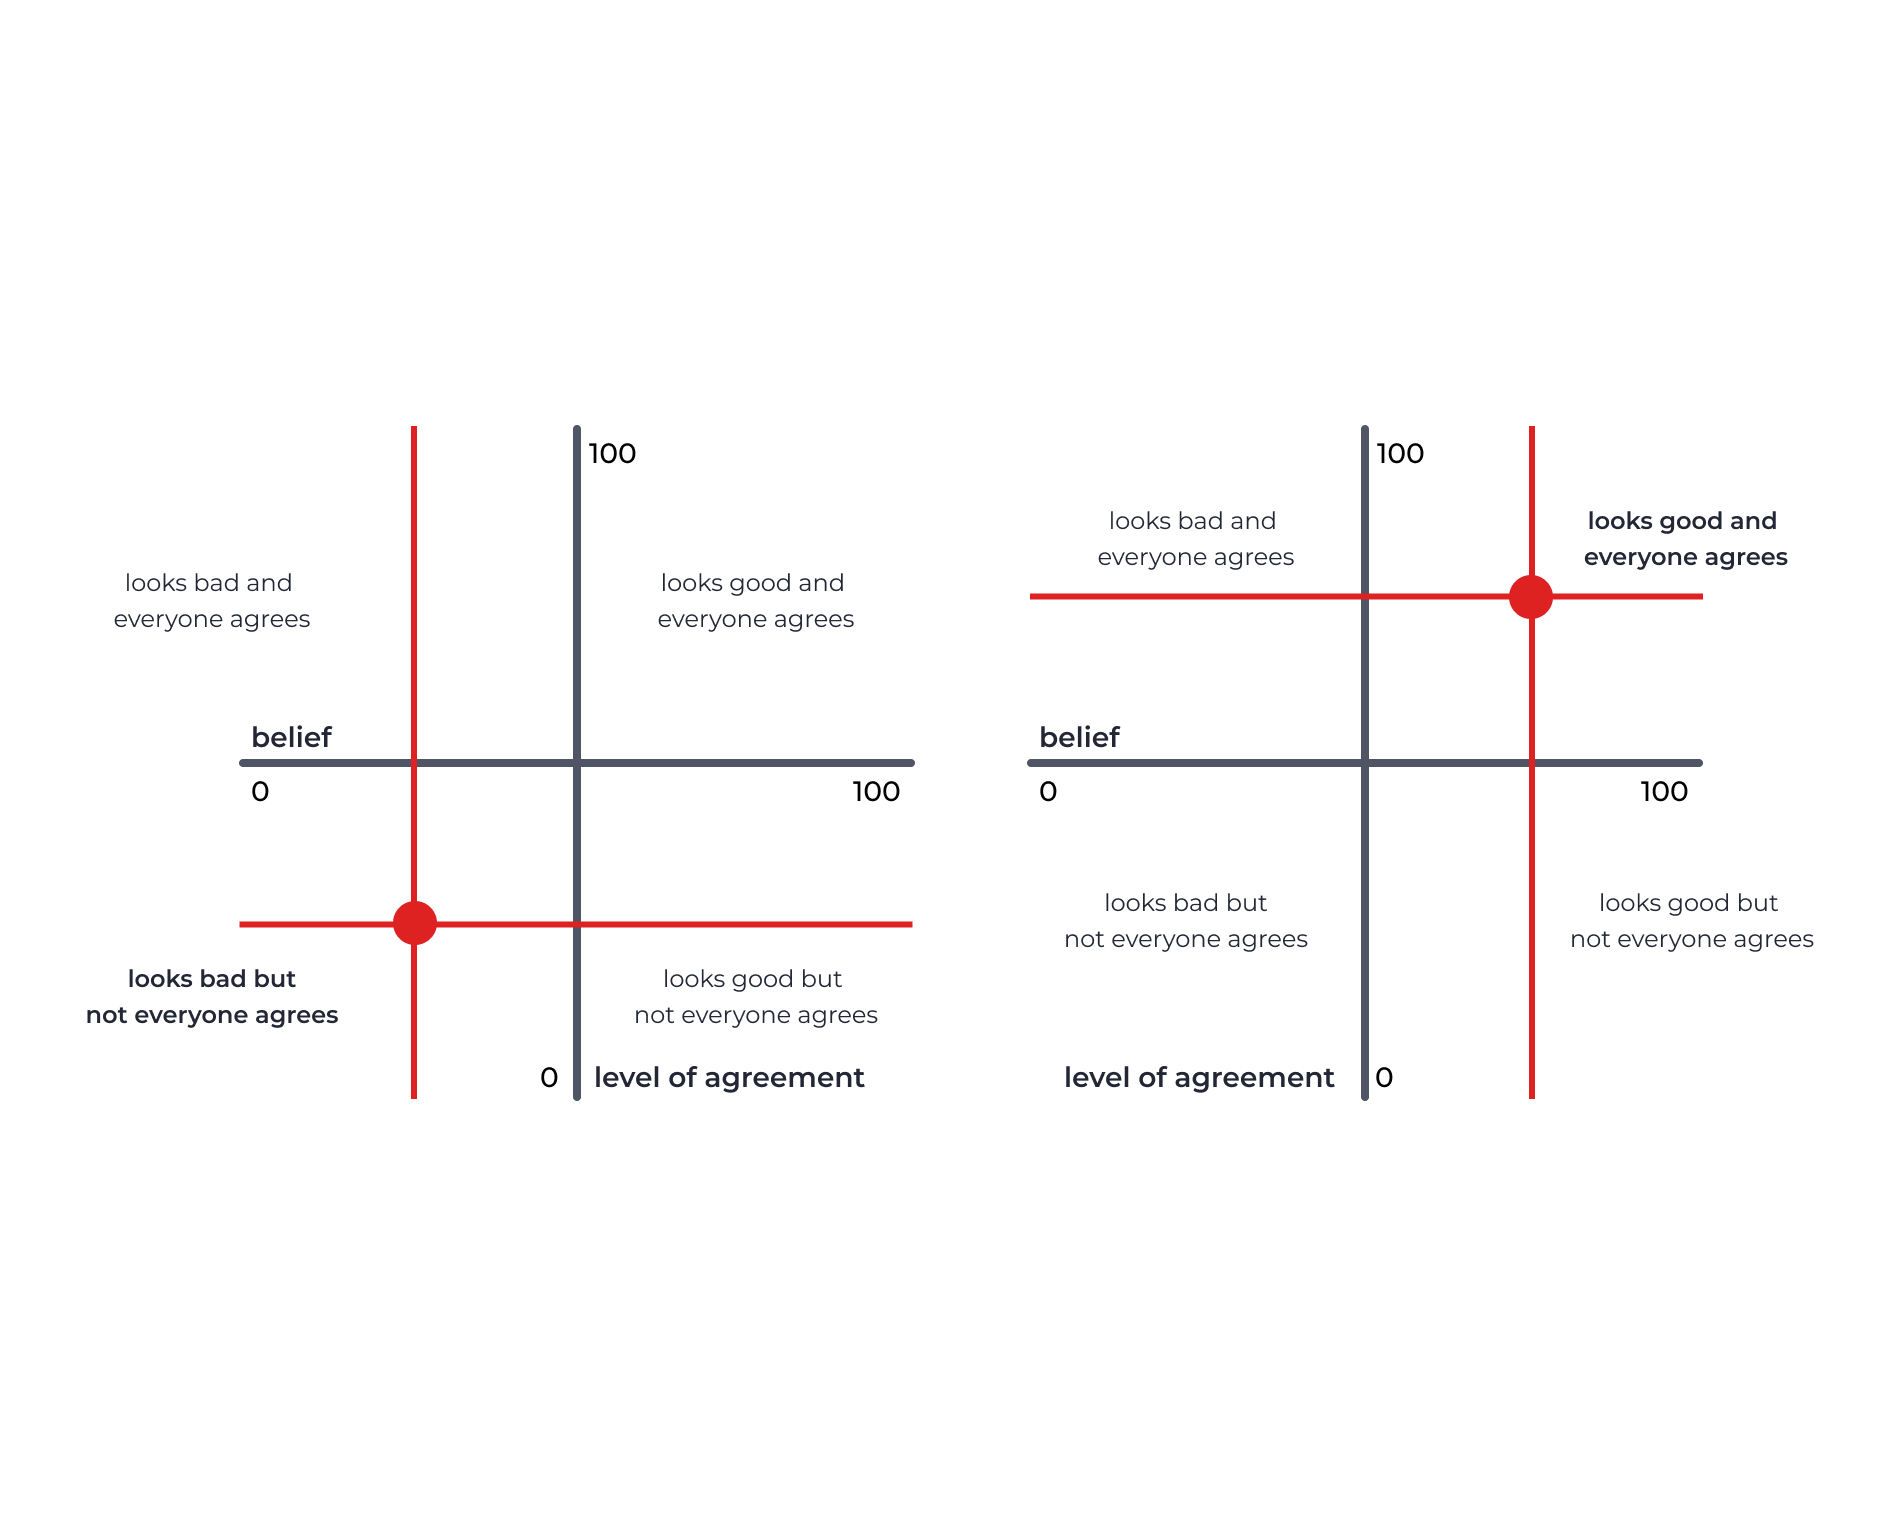
in the image on the left we tightened the criteria to 70% belief and 70% consensus and in the image on the right we loosened the criteria to 30% belief and 30% consensus. here it is worth noting that reducing the consensus criterion can compromise the team’s engagement in the progress of the project. people tend to be more engaged with what they most agree on.
how to analyze the results of collaborative choices?
with the proposals distributed in the quadrants, it is possible to issue an opinion on each of them, as described in the table below. proposals from the upper-right quadrant must be approved, proposals from the upper-left quadrant must be rejected and proposals from the lower quadrants must be re-evaluated in debates between people so that they seek alignment of their positions, deepening everyone’s arguments.
how to make collaborative choices in a simple way?
there is no free lunch. but in this case there is strateegia.digital, a platform that simplifies the application of mechanisms such as these, in co-creation and co-selection, through interfaces that dispense people with the effort and even understanding of the calculations and statistics behind the dynamics.
in strateegia.digital it is possible to create a point of divergence and invite the people to propose hypotheses and debate each other’s proposals to from structuring questions that guide the dynamics of co-creation of simple way.
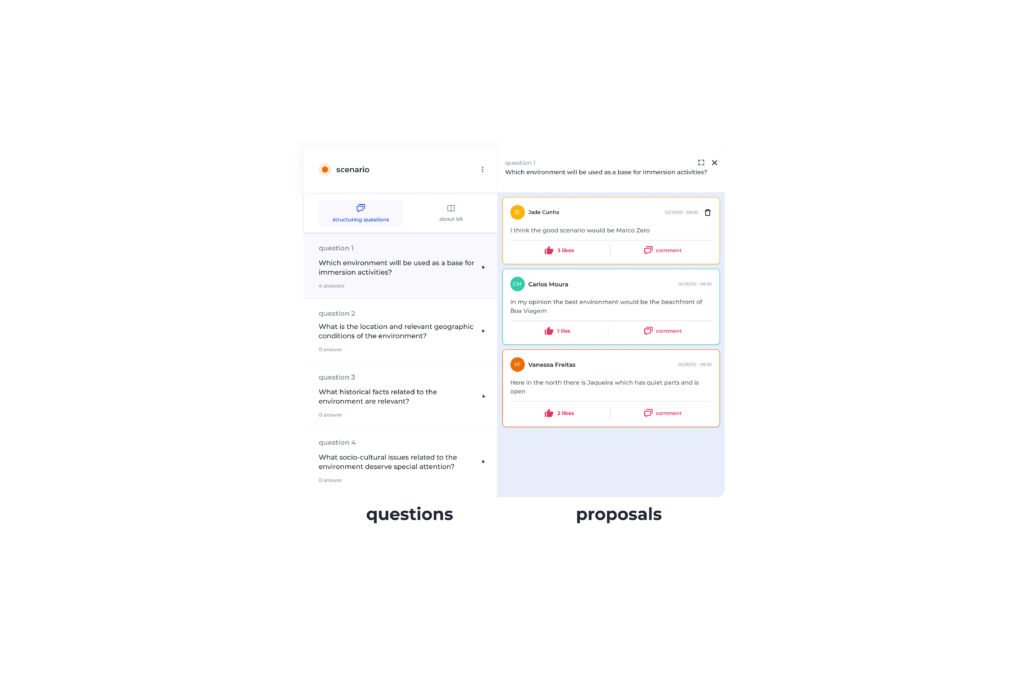
and to make the debate even more balanced, it is possible to activate the anonymous mode, where people do not know the authors’ names.

as all debates are written on a digital platform, it is clear that the data can be processed and the strategy automatically generates performance and impact indicators, as well as classifying the debates in the divergence matrix.
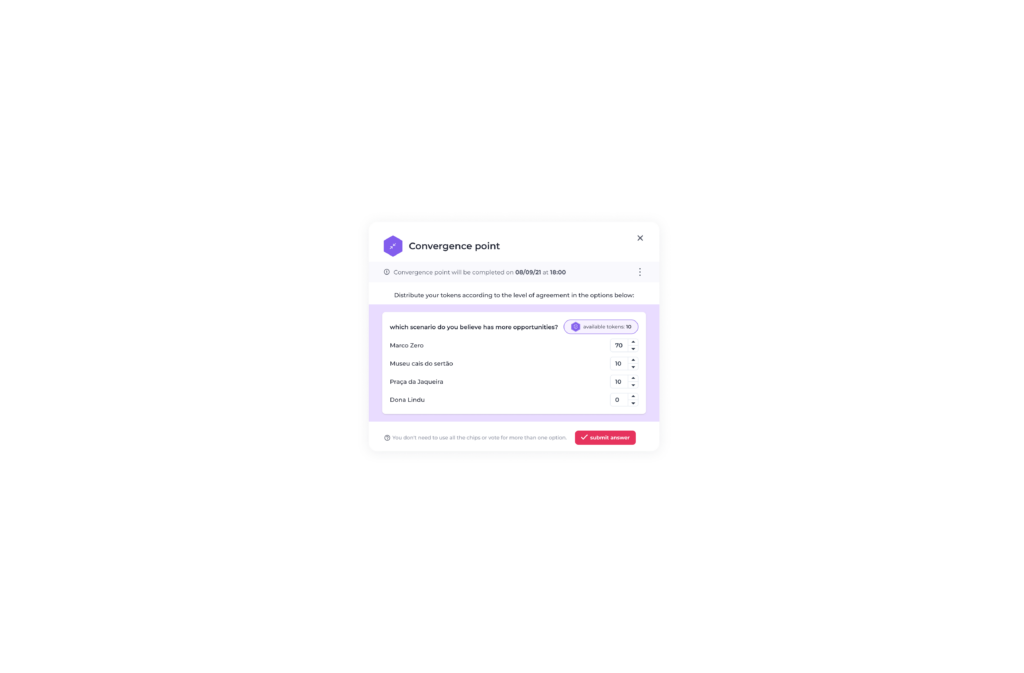
but the process of creative collaboration is not limited to the phase of divergences, it is also necessary to deal with convergences. at strateegia.digital it is possible to create points of convergence and invite people to declare their beliefs anonymously in the proposals generated in the divergent debates.
from the data declared by the people of the creative collaboration team, strateegia generates the indicators of belief and consensus as in the image below.
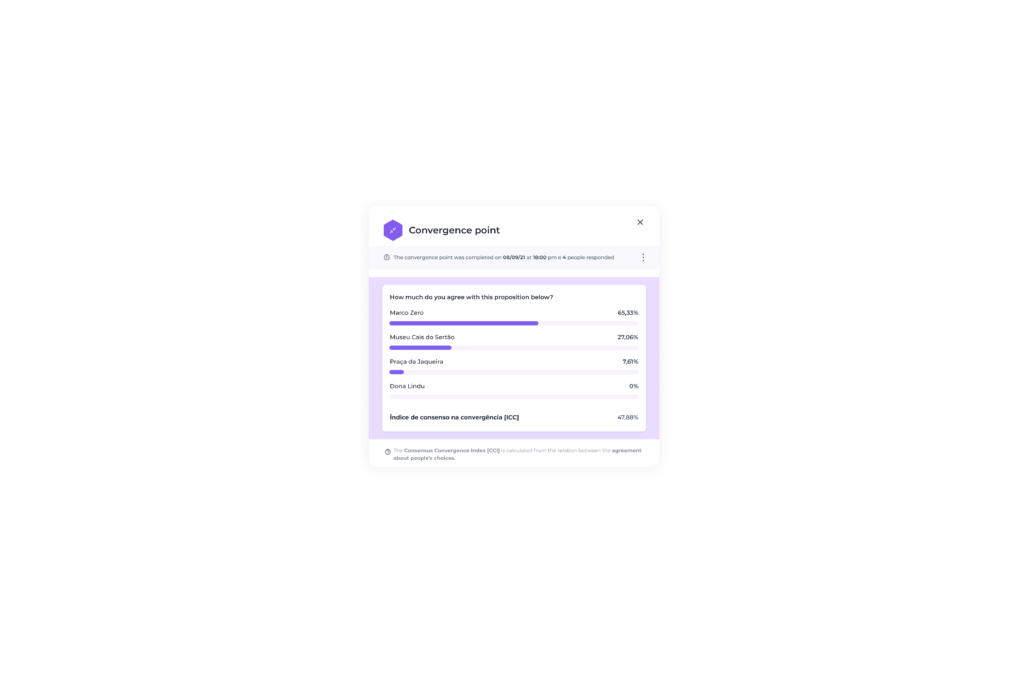
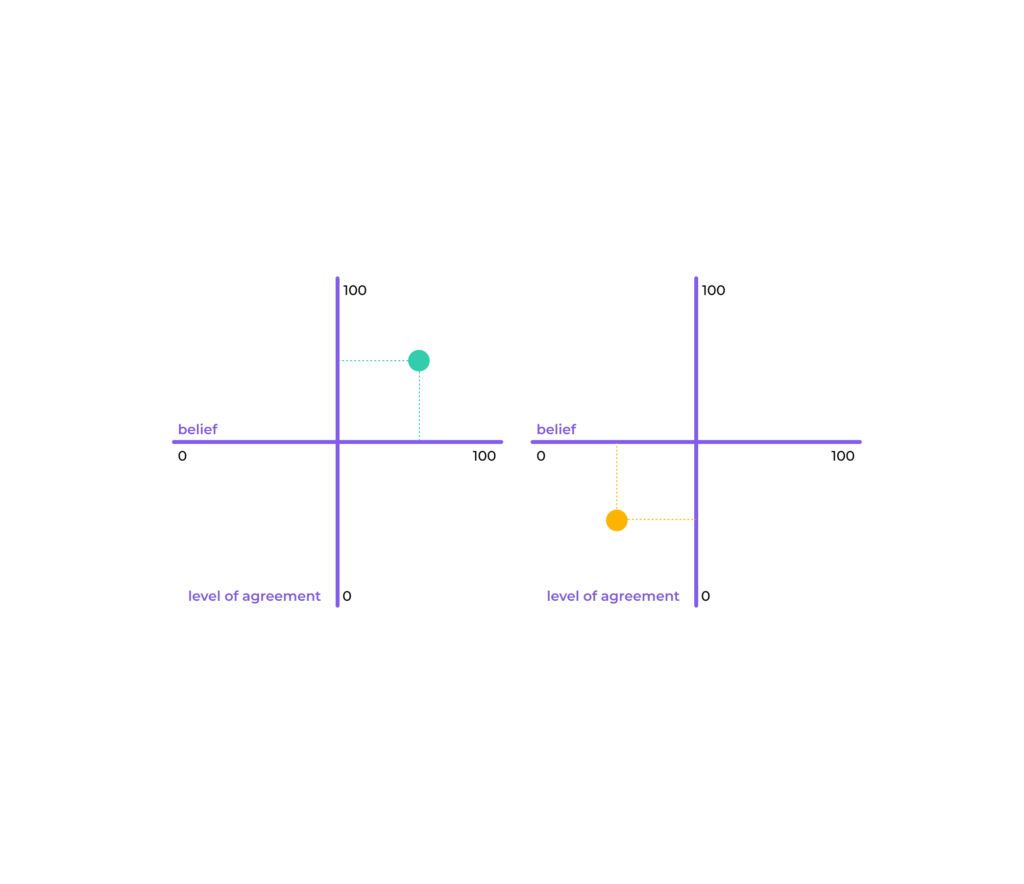
finally, with the indicators it is possible to position the proposals in the convergence matrix, making it simple for those who are participating in the collaboration process to perceive the team’s alignment.
about the authors:
andréneves, designer, professor at ufpe’s design department since 1996 and associate scientist at the strateegia.digital platform.
[https://www.linkedin.com/in/andremmneves/]
silvio meira, computer scientist, extraordinary professor at cesar.school, proficient teacher at ufpe, member of several boards of directors in large businesses in brazil and chief scientist of the strateegia.digital platform.
[https://www.linkedin.com/in/silviomeira/]
filipecalegário, computer scientist, artist, adjunct professor at ufpe and contributing scientist to the strateegia.digital platform
[https://www.linkedin.com/in/filpe-calegario/]